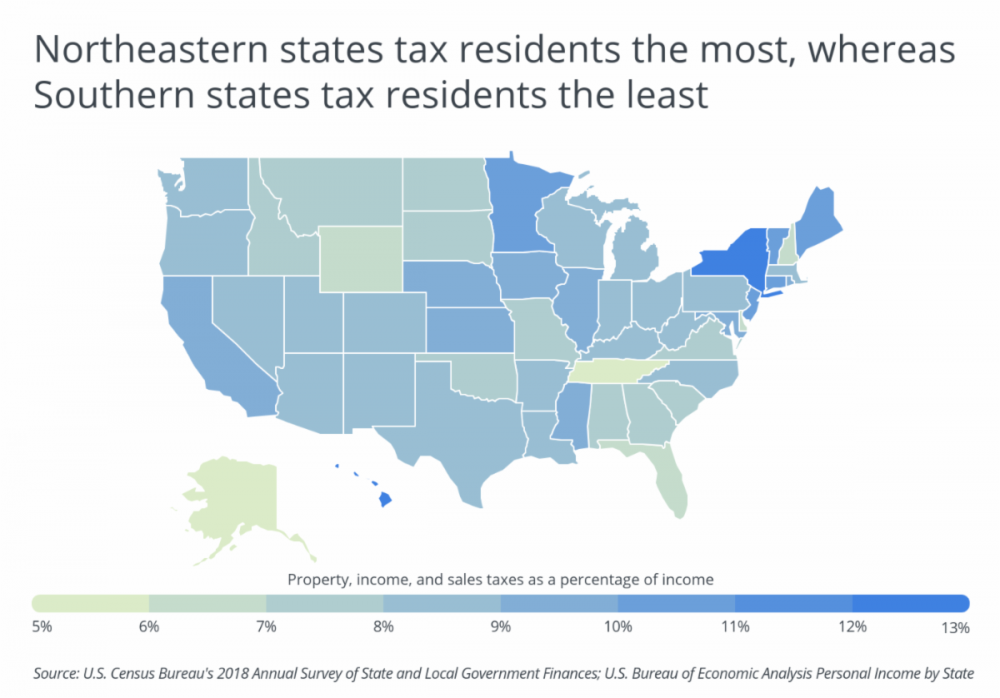
What is the landscape of taxes in America going into 2021? The Tax Cuts and Jobs Act, which was signed into law in 2017 by President Trump, reduced personal income tax rates for most people across the nation. However, that same piece of tax legislation also put a cap on state and local tax (SALT) deductions. Formerly, taxpayers who itemize could deduct the total amount of state and local taxes paid from their federal tax return, which significantly reduced an individual’s federal tax burden. But the new tax code caps SALT deductions at $10,000—a change that has made living in high-tax states even more expensive for high earners.
The three largest types of state and local taxes that impact residents in those states are sales, property, and individual income taxes. Based on data from the U.S Census Bureau’s most recent Annual Survey of State and Local Government Finances, Americans paid $1,869 in sales taxes, $1,301 in income taxes, and $1,672 in property taxes per capita in 2018. Combined, this equates to $4,842 per capita, or approximately 8.9% of per capita income. But, the total amount of taxes paid and the allocation of those taxes across sales, income, and property vary widely by state.
Here is a summary of the data for Tennessee:
• Property, income, and sales taxes as a percentage of income: 5.70%
• Annual property, income, and sales taxes per person: $2,694
• Property taxes as a percentage of income: 1.69%
• Income taxes as a percentage of income: 0.08%
• Sales taxes as a percentage of income: 3.93%
For reference, here are the statistics for the entire United States:
• Property, income, and sales taxes as a percentage of income: 8.88%
• Annual property, income, and sales taxes per person: $4,842
• Property taxes as a percentage of income: 3.07%
• Income taxes as a percentage of income: 2.39%
• Sales taxes as a percentage of income: 3.43%
For more information, a detailed methodology, and complete results, you can find the original report on HireAHelper’s website: https://www.hireahelper.com/


